Free browser-based modeling

No login. No live quote feed. Every premium and assumption stays editable.

Review formulas
Free options strategy analysis

Options profit calculator with P&L chart, heatmap and Greeks

Build a single or multi-leg options position, edit every assumption, and see modeled profit or loss across stock prices and time. Start with the long call below or choose any preset strategy.

  • 28 strategy templates
  • Black-Scholes estimates
  • No signup required
BullishCalculations update instantly
Underlying and model
Chart and analysis
Stock price range
Strategy legs
1
Net debit / credit
Debit $450
Max profit
Unlimited
Max loss
$450
Break-even
$104.50
Probability of profit
33.0%±$10 expected move
P&L at current price
-$31
Options strategy profit and loss chartModeled profit and loss by stock price today, halfway to the analysis date, and on the analysis date.$-894$717$2.3k$3.9k$5.5k$45$63$82$100$118$137$155TodayMidpointExpiration
Position analytics

Net option Greeks at the current inputs

delta
54.20
gamma
4.035
theta
-4.95
vega
13.93
rho
6.17

Models use user-entered prices and Black-Scholes estimates. Probability of profit uses a risk-neutral lognormal distribution with the default IV, rate, dividend yield, and analysis horizon; it is not a forecast. Results exclude assignment, early exercise, bid-ask slippage, taxes, margin changes, and live market events.

From inputs to decisions

What an options profit calculator should reveal before you trade

A useful options profit calculator does more than return one number. It should show how stock price, time to expiration, implied volatility, and every strategy leg can change the modeled result while keeping each assumption visible and editable.

Payoff chart

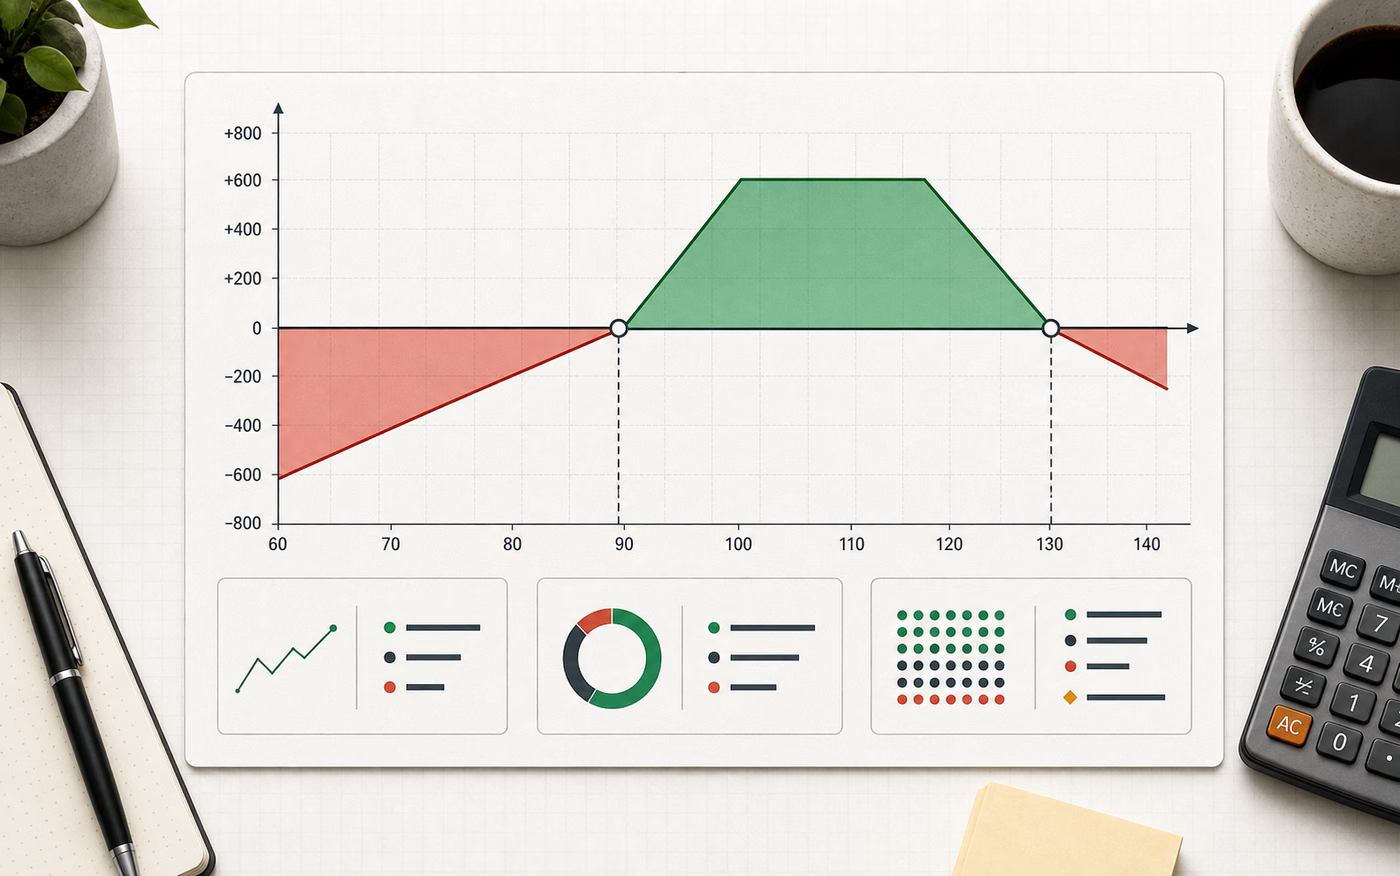
Read profit, loss, and break-even points at a glance

The options profit calculator plots the underlying stock price on the horizontal axis and modeled P&L on the vertical axis. The points where the curve crosses zero are the break-even prices, while the green and red regions make the range of possible profit or loss easier to scan.

Compare the position today, midway to expiration, and at expiration to separate remaining time value from the final payoff. Summary values keep the net debit or credit, maximum profit, and maximum loss next to the chart.

  • Profit and loss across a configurable stock-price range
  • Break-even crossings and expiration payoff shape
  • Net cost, capped risk, and unlimited outcomes where applicable
Compare options strategy payoff shapes
Options profit calculator payoff chart showing profit, loss, and two break-even prices
Strategy builder

Build a multi-leg options position without rebuilding the math

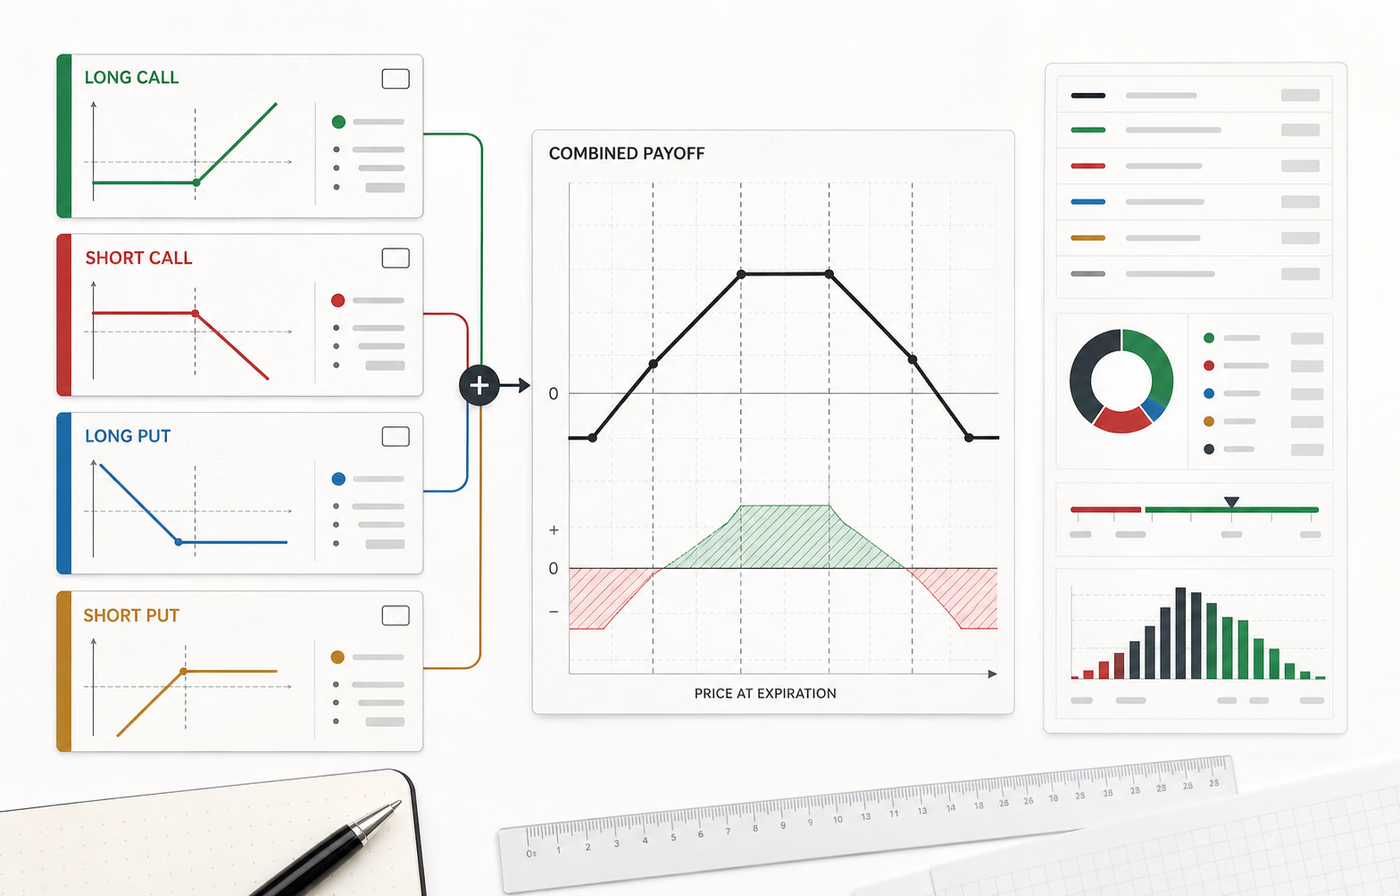
Use this options profit calculator for a long call, long put, vertical spread, iron condor, covered call, or a custom combination. Each call, put, or stock leg is calculated separately and then combined into one position-level result.

Strategy presets provide a practical starting point, while editable direction, strike, premium, quantity, volatility, and days to expiration let you match the assumptions you want to test. No brokerage connection is required.

  • Long and short call, put, and stock legs
  • Editable premiums instead of hidden quote assumptions
  • Single-leg, spread, and custom multi-leg strategy templates
Open the four-leg options strategy builder
Multi-leg options profit calculator combining long and short call and put positions
Scenario analysis

Stress-test stock price, time decay, and implied volatility

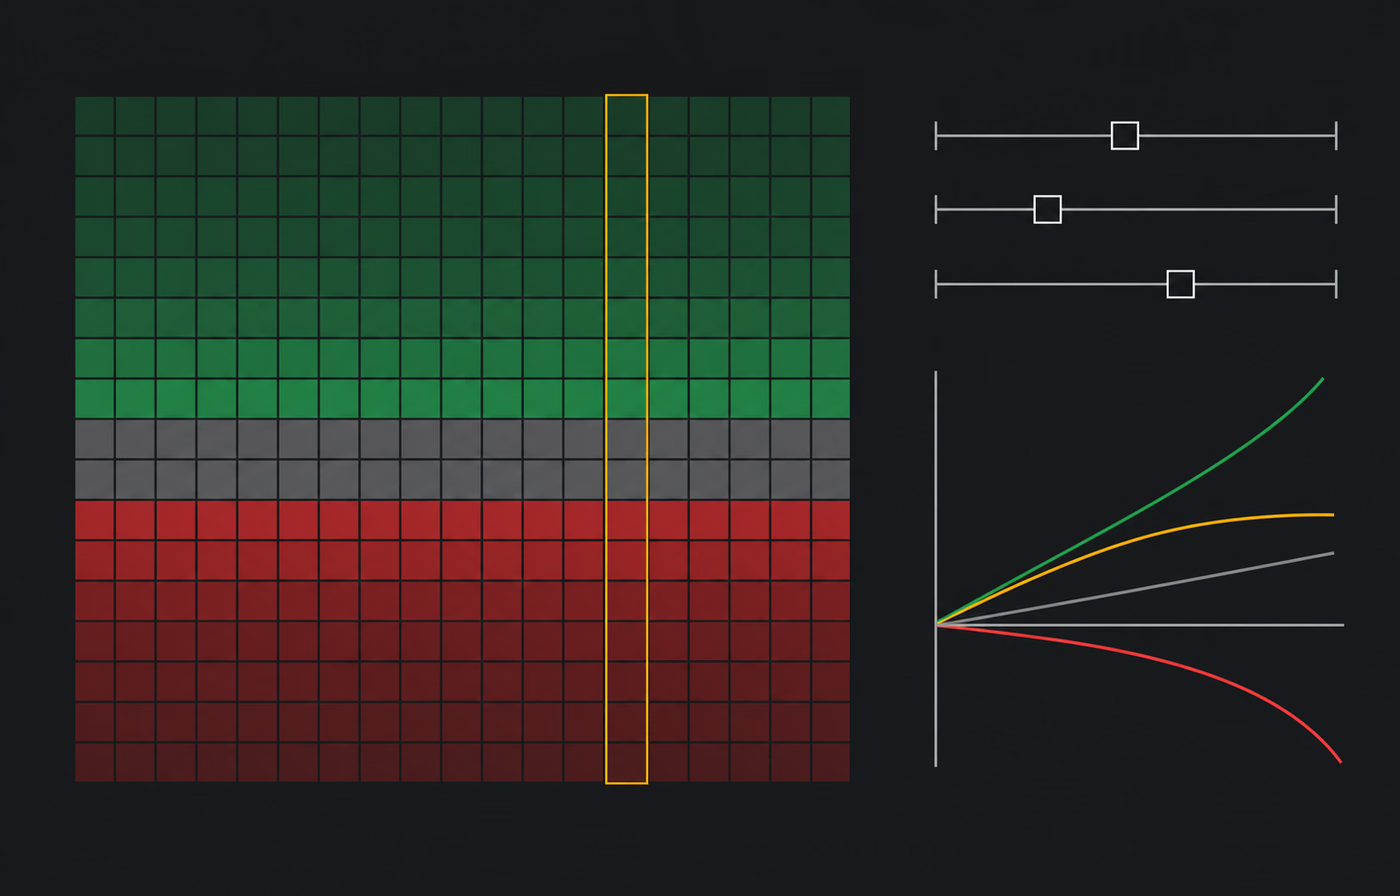
A useful options profit calculator should not treat one market path as certain. Change the stock price, analysis date, or implied volatility to see how the same position can move from profit to loss across the price-and-time heatmap.

Net delta, gamma, theta, vega, and rho add a second view of risk. These Greeks are local Black-Scholes estimates, so they are most useful when you recalculate after changing the assumptions rather than treating one snapshot as a forecast.

  • Price-by-time profit and loss heatmap
  • Net Greeks for the complete options position
  • Transparent Black-Scholes inputs and model limitations
Review the options calculation methodology
Options profit calculator heatmap for stock price, time, and implied volatility scenarios

Options profit calculator formula at expiration

At expiration, a call is worth the greater of the stock price minus the strike price or zero. A put is worth the greater of the strike price minus the stock price or zero. For a purchased option, the calculator subtracts the premium paid; for a written option, it reverses that result. Each option value is multiplied by the contract quantity and the standard 100-share multiplier. Stock legs use the difference between the modeled stock price and entry price multiplied by shares.

Adding every leg produces the strategy P&L at each stock price. This creates the expiration line, break-even crossings, maximum modeled profit, and maximum modeled loss. Unlimited results are identified from the payoff slope rather than shown as an arbitrary large number.

Options profit chart before expiration using Black-Scholes

Before expiration, intrinsic value alone is incomplete because an option can retain time value. The chart and heatmap use the Black-Scholes model with the stock price, strike, remaining time, volatility, risk-free rate, and dividend yield entered in the workspace. The value of each leg is compared with its entered premium to estimate open-position profit or loss.

Black-Scholes is a useful common model, not a promise of market value. American-style exercise, discrete dividends, volatility skew, liquidity, jumps, assignment, borrow costs, and the bid-ask spread can make a tradable quote differ from the estimate. Those differences are why every premium and volatility field is editable.

Net Greeks for a multi-leg options strategy

Delta estimates directional sensitivity, gamma estimates how delta changes, theta estimates one day of time decay, vega estimates sensitivity to one volatility point, and rho estimates sensitivity to one interest-rate point. The calculator multiplies each leg's Greeks by direction, contracts, and the contract multiplier before adding them into a net position value.

Greeks are local estimates: a single value describes the position near the current inputs, not at every possible stock price or future date. Recalculate after changing price, time, volatility, or any leg to understand how the exposure moves.

Options probability of profit estimate and model limitations

The probability of profit estimate uses a risk-neutral lognormal distribution with the default volatility, rate, dividend yield, and analysis horizon. It is not a forecast and does not establish liquidity, execution quality, margin treatment, assignment behavior, tax outcome, or suitability. Check live quotes, contract specifications, corporate events, exercise style, and broker requirements independently before making a decision.

You can save scenarios in the current browser, copy a shareable input link, or export the modeled price table to CSV. Saved inputs are for comparison and record keeping; they are not connected to a brokerage account and cannot place an order.